R&D Portfolio Management: a guide to optimize your projects

In the complex world of Research and Development (R&D), project managers and project management offices face a maze of uncertainties: projects that can take years or even decades to complete, tight budgets and sometimes huge costs for questionable benefits, or complex management of resources over the long term.
And the question that torments 70% is: “How to choose good projects to obtain the desired outcomes?”.
Do you think that R&D portfolio management is an impossible task? Not at all! Here we will examine the founding principles of a methodology designed to provide you with the keys to better prioritize, manage and monitor your R&D project portfolio.
See the NDP solution in action and get a personalized demo
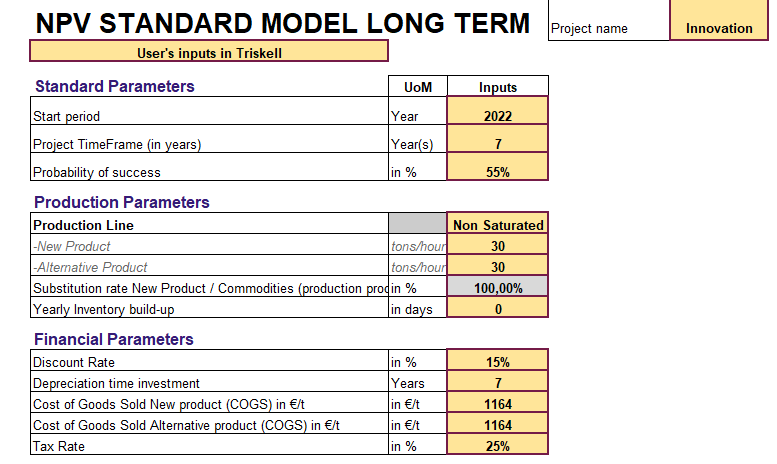
Customized financial reporting: the starting point for profitability
Money is the most pressing issue, so don’t forget to prepare a customized financial report as a matter of priority. This will give you an overview of the financial health of your projects at all times.
It is essential to use the same financial indicators for each of the projects in order to be able to compare them objectively and make the right decisions.
You should ask yourself which financial indicators, standard or specific, are the most relevant:
- Net Present Value?
- Internal Rate of Return?
- Return on Investment (ROI)?
- Payback ?
- Other indicators specific to your organization? Which ones?
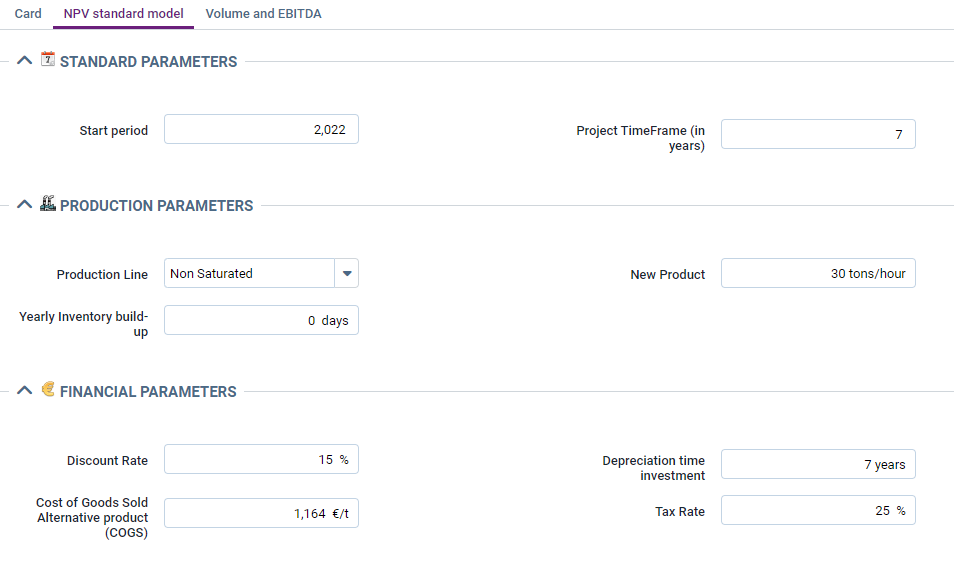
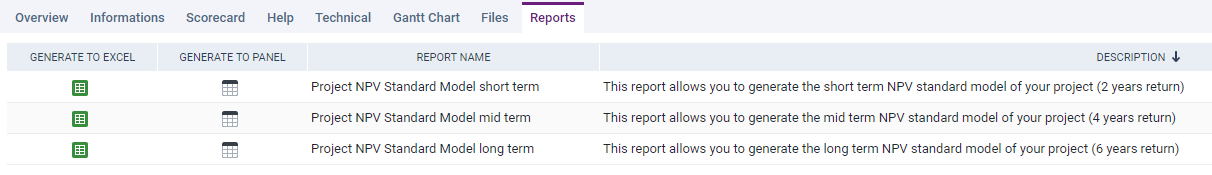
After this analysis and a consensus on the KPIs to be followed, it is essential that you can, in each of your projects:
- Enter in a simple way in a centralized register the financial data that will allow you to calculate these indicators.
- Generate a customized report for each project or for the portfolio as a whole.
This will give you the visibility you need to benchmark your projects against these indicators and make decisions based on reliable data.
Evaluate your R&D Portfolio Management from all angles with the scoring method
Financial KPIs are essential, but not sufficient. It is recommended that you provide your project managers with a set of criteria, some of them specific to your core business, so that they can evaluate your projects as comprehensively as possible.
At Triskell, we recommend the scoring method to evaluate your projects in-depth. It brings new elements of comparison between your projects and enhances your work.
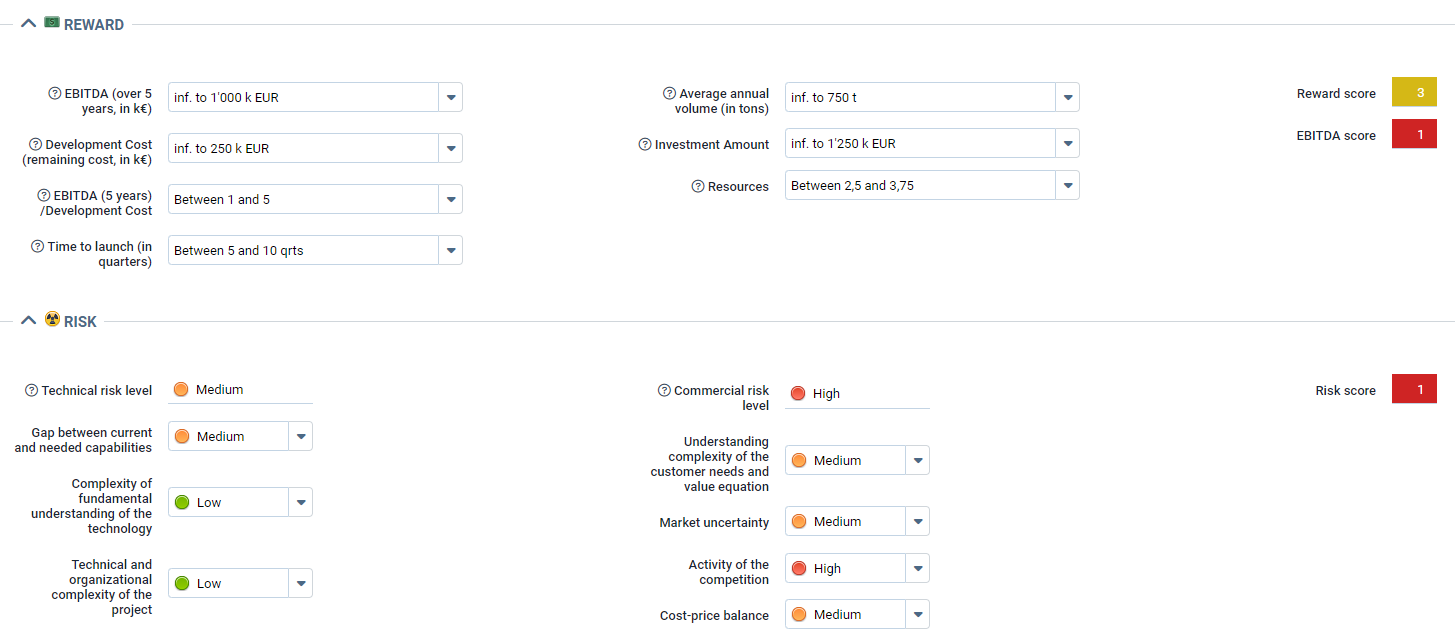
To this end, the evaluation criteria for each project must be documented according to different topics:
- Profitability criteria.
- Risk criteria.
- Strategic impact criteria.
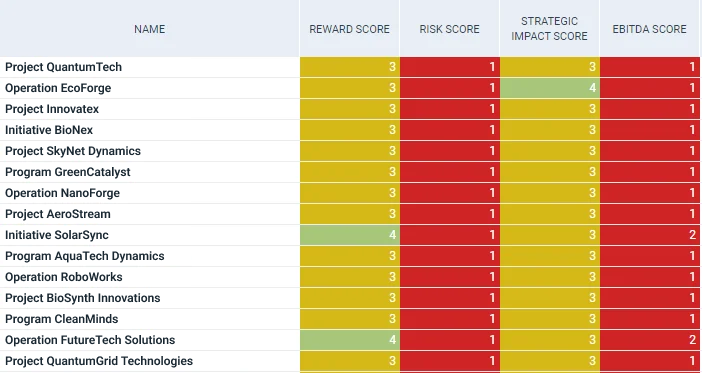
The table below is illustrative and is based on a portfolio of industrial projects.
Profitability criteria |
Development costs, average annual volume (in tons), amount of investment, ETPs required. |
|---|---|
|
Risk criteria
|
Market volatility, competitive activity, regulation, technical or technological complexity.
|
|
Strategic impact criteria
|
Competitive advantages, alignment with strategic vision, impact on current activities, value for the customer.
|
See the NDP solution in action and get a personalized demo
To avoid bias, neither the weighting nor the scoring of each criterion should be disclosed to project managers.
That’s it! The result is a side-by-side comparison of the projects with their different scores.
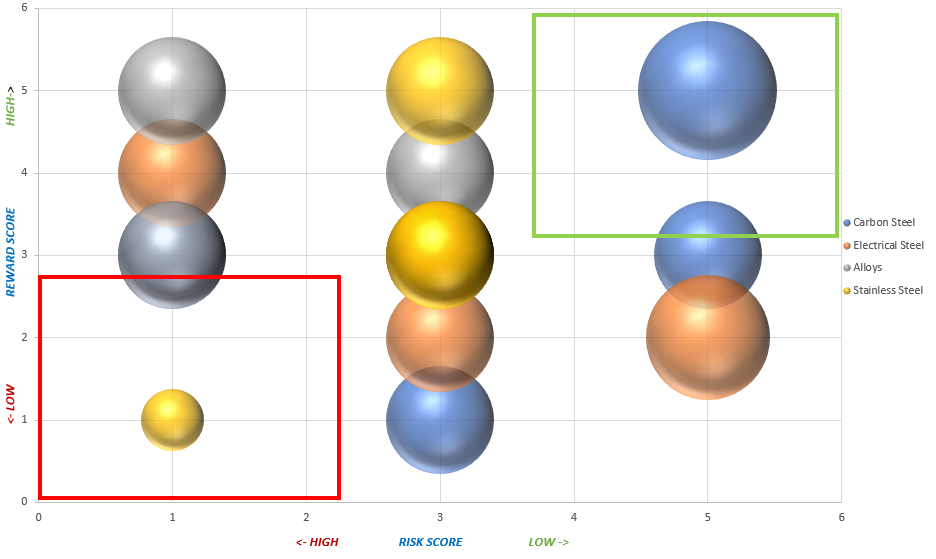
It is recommended that this information be presented in a customized report, such as a bubble chart, so that it is graphically and immediately legible.
Below is an excerpt from an industrial client’s project portfolio. The projects that stand out are Initiative SolarSync and Opération Future Tech Solutions, with a higher win score.
With the help of this chart, you can quickly identify the projects to be removed, located in the red box, as well as those that meet the requirements, located in the green box. Core projects should be promoted to achieve the green box by giving them the necessary means (team building, hiring experts, optimizing the supply chain, optimizing production processes, allocating budgets, etc.).
See the NDP solution in action and get a personalized demo
Monitor the progress of your R&D projects with dashboards
This is even more important for R&D projects, which tend to have longer time frames than any other type of project. It is essential to regularly monitor these projects and ensure their relevance or feasibility against critical objectives.
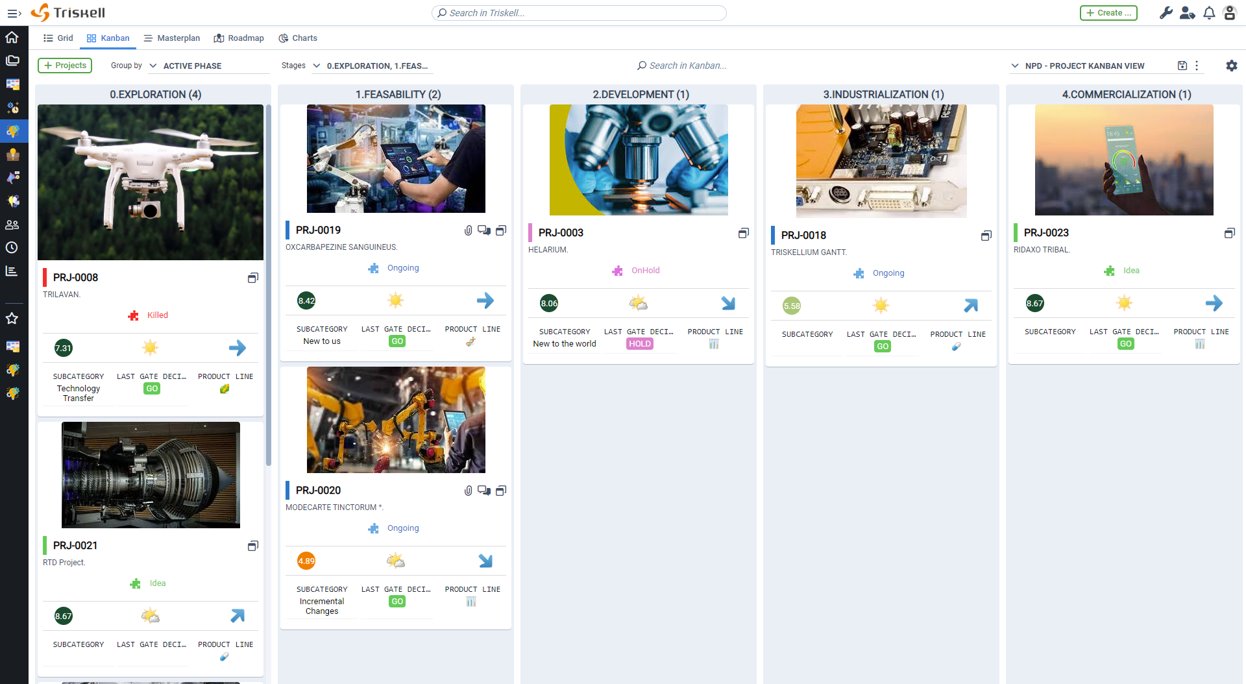
Phase-Gate methodology for tracking progress
Most of these projects adopt a Phase-Gate approach. This is the methodology we recommend at Triskell for R&D projects.
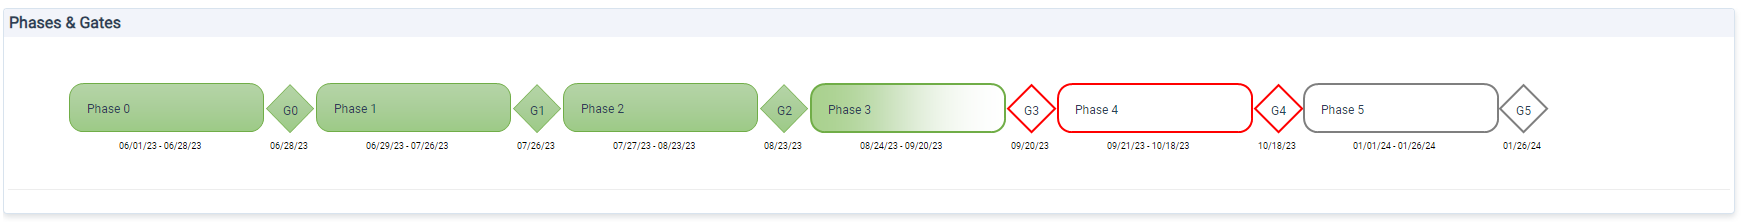
Each project is divided into phases: e.g. idea, feasibility, conception, industrialization and commercialization. Each phase is marked by a milestone or Gate at which the project is re-evaluated.
This reassessment makes it possible to verify that the project is consistent with the company’s strategy, remains technically or technologically appropriate, continues to be profitable, etc.
This article details the strengths of the Phase-Gate methodology:

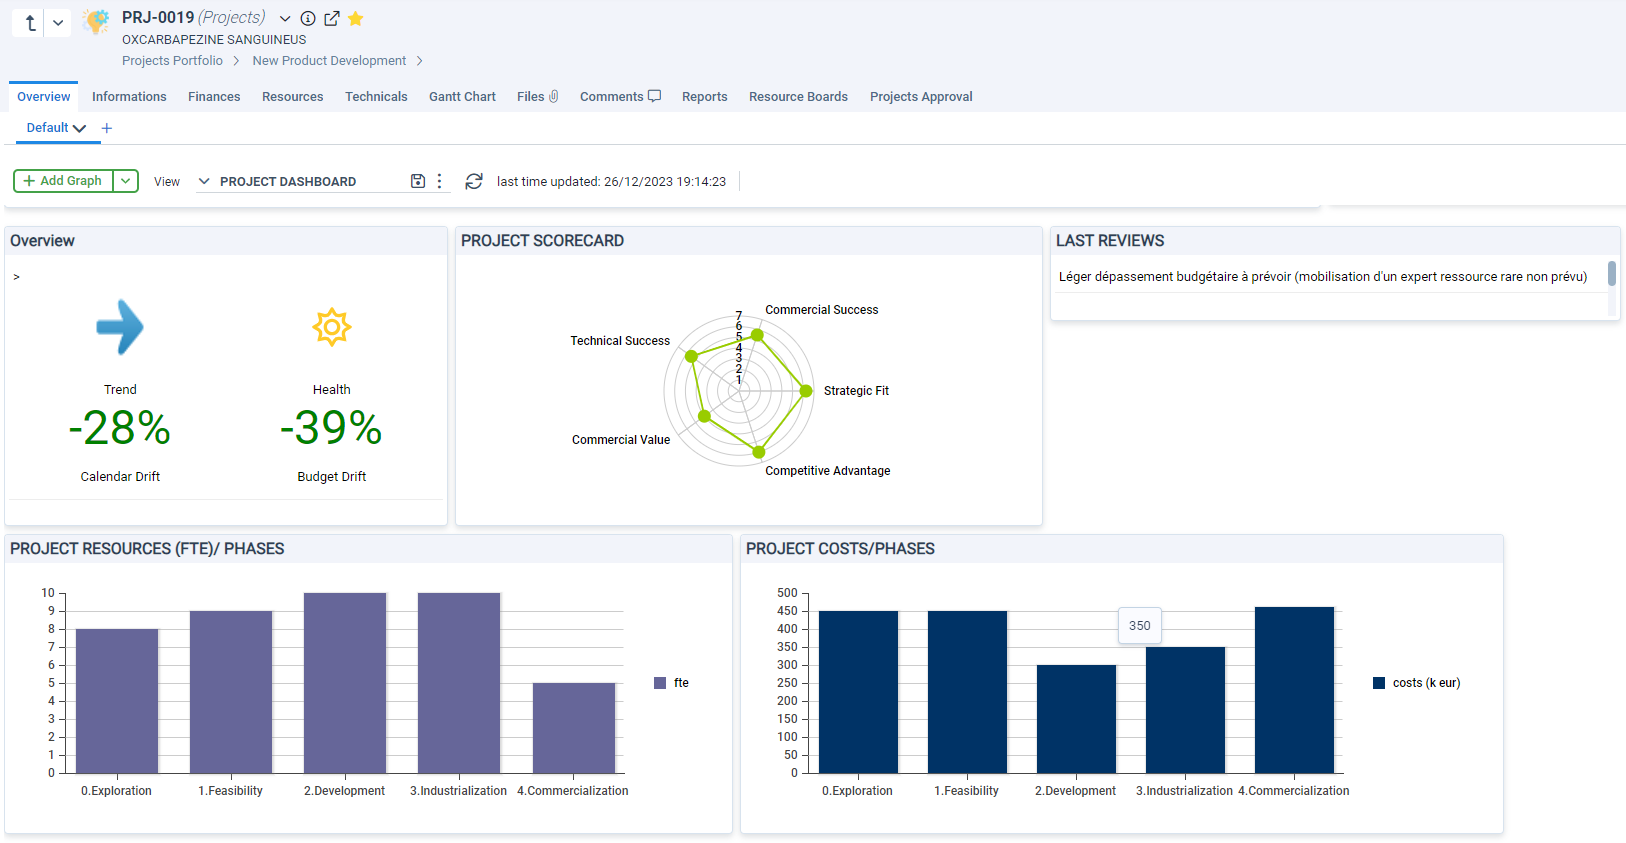
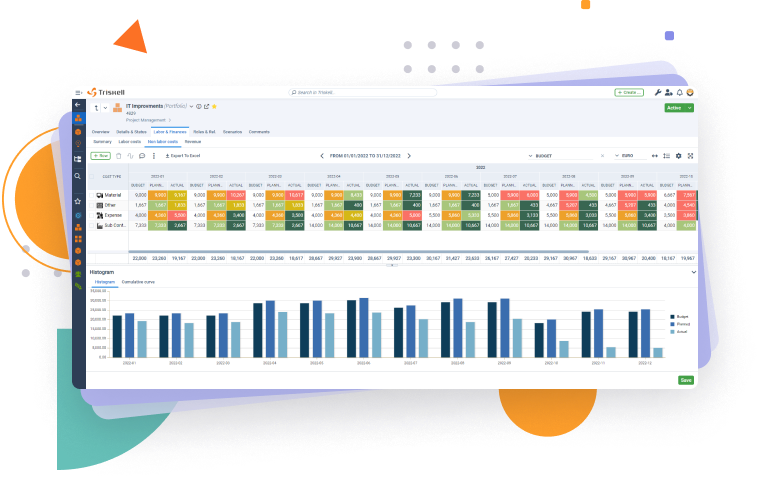
Dashboards, an essential management tool
Adopting this approach is important, but the right tools must be in place to monitor and measure this progress. A customized dashboard containing, for example, a chronological chart with all the phases and milestones of the project is a great advantage for monitoring.
The dashboards should be complemented with other monitoring indicators depending on your needs, such as the SPI (Schedule Performance Index), which measures project efficiency in relation to the planned schedule, or the CPI (Cost Performance Index), which measures project efficiency in relation to the budget. Everything can be exported to Powerpoint or PDF to share with your collaborators.
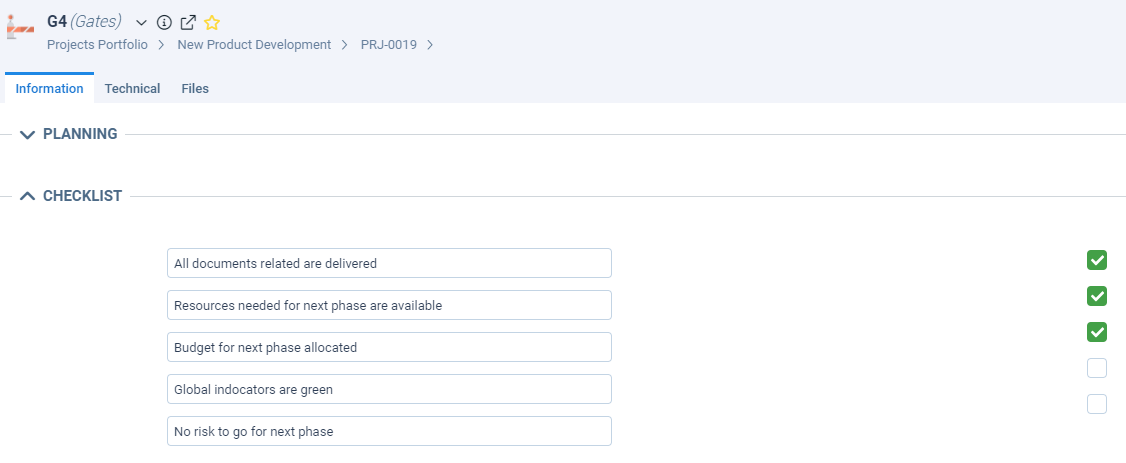
Interest in milestone checkpoints culminates in the use of a checklist to verify that the expected results at the milestone have been validated and are available.
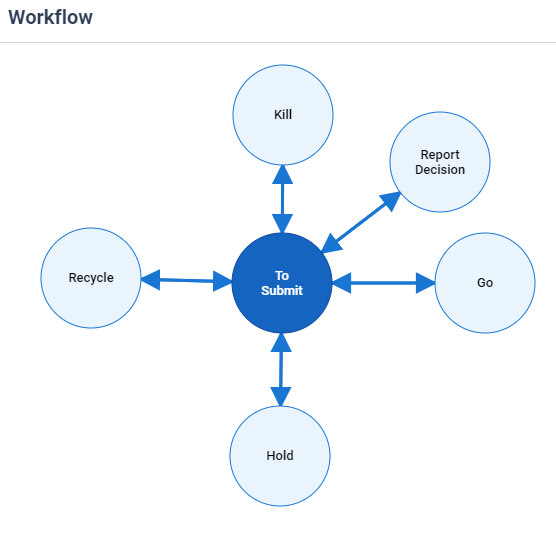
The execution of a workflow allows to ratify the decision taken by the committee, i.e. whether the project should:
- Proceed to the next phase (go)
- Abandon (kill)
- Temporarily suspend (hold), etc.
Milestone checkpoints, with a checklist and workflow, ensure that only projects consistent with the company’s strategic requirements progress. Projects that are not consistent will be disqualified and stopped in time.
Ensure the financing of your innovation projects
The financing of your R&D projects can be optimized through schemes such as the Innovate UK Smart Grants, with which UK registered organizations can apply for up to £25 million for R&D innovations that are transformative and commercially viable.
However, this plan is subject to strict auditing, so you will have to identify the activities eligible for CIR and establish a record of the time spent by your employees, in order to prepare specific reports to justify the credit claim.
We recommend establishing a tool for tracking and recording data, so that it can be easily audited.
Leverage a PPM tool dedicated to R&D Portfolio Management
That’s it as far as the process is concerned. That said, this approach is useless if it is not well put together. Centralized, uniform, reliable and tangible information must be available to make good decisions quickly.
Forget about Excel files, as they are never up to date and impossible to integrate, you need dynamic dashboards, updated in real time and available in a single click!
On the other hand, a good project portfolio management tool will become your best ally.
At Triskell Software, we have extensive experience working with R&D managers and project management offices in many SMEs and large companies around the world. Our NPD Ready solution (NPD for New Product Development) will allow you to overcome this phase with ease, putting at your disposal:
- A predefined data model compatible with Phase-Gate and other approaches.
- A collection of relevant metrics and KPIs at your disposal.
- Specific functionalities such as resource management and capacity planning, time recording, risk analysis and master planning at all levels and for all stakeholders, from R&D managers to sponsors, project management offices and project managers.
See the NDP solution in action and get a personalized demo
Conclusion
In summary, this methodology is not only a solution, but also a transformation. This approach equates to a clear vision amidst the turmoil of innovation, to decisions based on predicted data rather than guesswork.
Now you know the recipe for building an optimal portfolio of R&D projects: you must choose and measure the right indicators, evaluate them using scoring tools, meticulously and regularly monitor the progress of the projects using the phase-gate methodology, and encourage the funding of these projects.
Don’t let your portfolio of R&D projects remain in no man’s land. Let’s get to work!

Sofyân BICEP
Sofyân is a senior consultant at Triskell Software, specialized in project portfolio management in the industrial sector.
Subscribe to our Newsletter
Get stories like this in your inbox
Request a demo of Triskell Software
Do you think Triskell Software is the solution you need to take your organization’s resource management to excellence? If so, request a demo of Triskell.
FAQs about R&D Portfolio Management
What are the benefits of R&D Portfolio Management?
R&D Portfolio Management (R&D PPM) offers several advantages over a scattered approach to managing innovation projects. Here are some key benefits:
- Improved Project Selection: By evaluating projects based on strategic alignment, market potential, and risk profile, R&D PPM helps you choose the initiatives with the highest chance of success.
- Optimized Resource Allocation: Limited resources are a constant concern in R&D. R&D PPM ensures personnel, equipment, and funding are directed towards the most promising projects, avoiding overallocation and missed opportunities.
- Enhanced Risk Management: R&D projects inherently involve uncertainty. R&D PPM helps you identify and mitigate risks proactively, allowing for course correction and minimizing potential setbacks.
- Stronger Strategic Alignment: R&D PPM ensures your innovation efforts are directly tied to your company’s overall strategy. Projects are selected and prioritized based on how they contribute to achieving long-term goals.
How is R&D Portfolio Management different from standard project management?
While traditional project management focuses on the successful execution of individual projects, R&D PPM takes a broader perspective. Here’s how they differ:
- Focus: Standard project management prioritizes on-time, on-budget completion of well-defined tasks. R&D PPM, however, emphasizes long-term vision, managing uncertainty inherent in innovation, and selecting projects with strategic value.
- Metrics: Traditional project management relies on metrics like timelines and milestones. R&D PPM considers factors like market potential, potential return on investment (ROI), and technological feasibility alongside project execution metrics.
- Flexibility: Standard project management thrives on predictability. R&D PPM acknowledges the need for flexibility and course correction as new information emerges during the R&D process.
What are the key challenges of R&D Portfolio Management?
Despite its benefits, R&D PPM comes with its own set of challenges:
- Uncertainty Management: Innovation often involves venturing into uncharted territory. Accurately predicting project outcomes and timelines can be difficult. R&D PPM requires robust evaluation methods to account for inherent uncertainties.
- Balancing Flexibility with Focus: While the R&D landscape can be dynamic, maintaining a focused portfolio is crucial. R&D PPM needs to strike a balance between adapting to changing circumstances and ensuring projects align with strategic goals.
- Measuring ROI: The true value of R&D projects often takes time to materialize. Developing reliable methods to assess the return on investment for R&D initiatives remains an ongoing challenge in R&D PPM.
What features should I look for in an R&D PPM tool?
Selecting the right R&D PPM tool can significantly streamline your innovation management process. Here are some key features to consider:
- Scoring Methods: A robust scoring system allows you to objectively evaluate projects based on pre-defined criteria like market fit, technical feasibility, and strategic alignment.
- Financial Tracking Dashboards: Real-time insights into project costs and resource allocation are crucial for informed decision-making. Look for tools with clear dashboards for financial tracking.
- Integration Capabilities: Ensure your chosen R&D PPM tool integrates seamlessly with existing project management and financial systems to avoid data silos and improve overall efficiency.
- Reporting and Analytics: Effective communication of R&D progress is essential. Look for tools that offer comprehensive reporting features and insightful data analytics to keep stakeholders informed.
Related Content

6 time-consuming activities PMOs will leave behind with a PPM tool
Boost Productivity NOW! Top time-Consuming activities PMOs MUST ditch TODAY! Say goodbye to waste! Learn More.
Project Management vs Project Portfolio Management: understanding the differences
Explore the intricacies of Project Management (PM) and Project Portfolio Management (PPM) in this comprehensive guide.

The ultimate guide to create a Strategic PMO for impactful PPM
In this post, we will show you the key roles and responsibilities of a strategic PMO, as well as the essential components and best practices for its success.
